
A 13-week cash flow forecast is a rolling, direct-method liquidity model that maps every dollar in and out across a quarterly window, updated weekly. Build it once, run it every Monday, and you will always know your tightest week before it arrives.
This is the model CFOs pull out when a lender calls, when a board asks about runway, or when payroll and a tax deposit land in the same week. The 13-week cash flow model has shifted from a restructuring tool to a standard leadership discipline used by CFOs, PE sponsors, and lenders — which means if you are not running one, you are already behind the curve.
To get started this week, you need three things:
- A reconciled opening bank balance (not book balance)
- An AR aging report and an AP aging report, both current
- A schedule of fixed outflows: payroll dates, tax deposits, debt service, and rent
A free 13-week cash flow template with a built-in runway calculator can get you to your first tightest-week number in under an hour.
Table of Contents
- What is a 13-week rolling cash flow forecast?
- Anatomy of a 13-week forecast: what goes in each row
- How do you build a 13-week cash flow model?
- How do you stress-test a 13-week cash flow forecast?
- How do you read the forecast output?
- What should a 13-week cash flow template include?
- Who owns the 13-week forecast, and how often should it update?
- Worked example: how one missed payment changes everything
- Key Takeaways
- How finance teams actually use the 13-week model
- Peregrine cuts the manual work out of your weekly forecast
- Further reading and source list
- A note on perspective
What is a 13-week rolling cash flow forecast?
The formal name in treasury circles is the TWCF, short for thirteen-week cash flow. It covers roughly one fiscal quarter, broken into 13 individual weekly columns, and it uses the direct method: actual cash receipts and actual cash disbursements, not accrual adjustments. A 13-week forecast is a rolling weekly direct-method forecast with highest accuracy in weeks 1–4 and directional insight in weeks 5–13, which is exactly how you should read it — high confidence near-term, directional further out.
The rolling rule is what keeps it alive. Every week, you drop the oldest week (replacing projections with actuals), add a fresh week 13 at the far end, and the horizon stays constant. That discipline is what separates a TWCF from a static quarterly budget.
When to use it:
- Weekly treasury discipline — Any business with tight working capital or seasonal cash swings benefits from a live 90-day view.
Limitations worth knowing: The TWCF is not an audited financial statement. It will be wrong in absolute terms — the goal is directional accuracy and early warning, not precision. Accuracy degrades naturally past week four because customer payment timing and vendor behavior become harder to predict.
Pro Tip: Before you build, decide which bank accounts and legal entities to include. A single-entity, single-account model is the fastest to build and easiest to trust. Add entities only when intercompany cash movements are material enough to affect your tightest week.
Anatomy of a 13-week forecast: what goes in each row
Every credible TWCF shares the same canonical layout. The rows run top to bottom; the columns are weeks 1 through 13.
| Section | Line Item | Notes |
|---|---|---|
| Opening | Beginning cash balance | Reconciled to bank, not general ledger |
| Receipts | AR collections | Mapped from invoice-level aging |
| Other inflows | Loan draws, asset sales, tax refunds | |
| Disbursements | Payroll and payroll taxes | Exact pay dates, not weekly averages |
| Accounts payable | Mapped from AP aging by due date | |
| Rent and fixed overhead | Exact contract dates | |
| Debt service | Principal + interest by due date | |
| Capex | Committed spend only | |
| Income and sales tax deposits | IRS and state deposit schedules | |
| Net | Net cash flow | Receipts minus disbursements |
| Closing | Ending cash balance | Opening + net; becomes next week's opening |
Working-capital roll-forwards
The four roll-forwards are where most of the modeling work lives. Each one feeds weekly cash numbers into the main schedule.
AR roll-forward: Start with the AR aging balance. For each open invoice, assign a projected collection week based on that customer's actual payment history (not the invoice due date — customers rarely pay exactly on time). Each week, actual collections replace projections, and the variance tells you whether the miss was timing or magnitude.
Inventory roll-forward: Track inventory purchases separately from AP. When you buy inventory, cash leaves when the AP invoice is paid, not when goods arrive. Map purchase orders to expected payment weeks using your standard payment terms.
AP roll-forward: Pull the full AP aging. Assign each vendor invoice to the week you plan to pay it. For vendors on net-30 terms, that is usually the due date; for vendors you stretch, it is later. Be honest here — optimistic AP timing is one of the most common model errors.
Accrued wages roll-forward: Payroll accrues daily but pays on specific dates. Map each pay date to its exact week. Include employer payroll taxes, which often hit a day or two after the payroll run itself.
The direct method works because it uses these actual transaction dates rather than smoothing everything into monthly averages. That is why it is the preferred tool for short-horizon liquidity decisions.
How do you build a 13-week cash flow model?
Building a credible TWCF from scratch takes a few hours the first time. The weekly update, once the model is running, takes 30–60 minutes.
The weekly cadence
The operational rule is to update weekly: drop the prior week, replace projections with actuals, and extend the window by one week to keep the forecast live and improving. In practice, this means:
- Friday: — Review variance log with the treasury owner. Escalate any red flags before the weekend.
A one-week calculation example
Say your Week 4 opening balance is $180,000. You expect $95,000 in AR collections and $12,000 in other inflows. Disbursements are $88,000 in payroll, $42,000 in AP payments, and $18,000 in a quarterly tax deposit.
Net cash flow: ($95,000 + $12,000) − ($88,000 + $42,000 + $18,000) = −$41,000
Week 4 closing balance: $180,000 − $41,000 = $139,000
If your minimum cash floor is $100,000, you have $39,000 of cushion in Week 4. That is fine — until you check Week 5 and find another large AP batch due.
Common AR/AP mapping errors
Mapping invoices to the wrong week is the single most common model error. The fix: use actual payment history, not invoice terms. If a customer consistently pays 45 days after invoice date despite net-30 terms, map their invoices to week 6 or 7, not week 4. The same logic applies to AP — if you routinely stretch a vendor to net-45, model it that way.
How do you stress-test a 13-week cash flow forecast?
Scenario modeling is where the TWCF earns its keep. A static forecast tells you what you expect; a stress test tells you what you can survive.
Running a fast sensitivity test
The fastest sensitivity test changes one assumption at a time and reads the tightest week. For AR slippage: shift every AR collection date out by one week and note the new minimum closing balance. For AP flexibility: push non-critical vendor payments out by one week and measure the improvement. These two levers together often reveal $50,000–$150,000 of timing flexibility that was invisible in the base case.
Pro Tip: Build a scenario toggle into your template: a single cell that shifts all AR collections by +1, +2, or +3 weeks. This lets you answer a lender's "what if collections slow down?" question in 30 seconds instead of rebuilding the model.
How do you read the forecast output?
A completed TWCF is only useful if you know what to look for. Three numbers matter most: the tightest week, the runway count, and the variance trend.
Tightest week is the lowest closing balance across all 13 weeks. This is your primary risk indicator. If it is above your minimum cash floor, you are operating with a buffer. If it is below, you have a problem that needs a mitigation decision this week.
Runway is the number of consecutive weeks where the closing balance stays above your floor. A runway of 13 means you are fully funded through the forecast window. A runway of 6 means you need a solution by week 7.
Variance trend tells you whether your model is improving. If week-over-week variance between projected and actual is shrinking, your collection timing assumptions are getting more accurate. If variance is growing, something structural has changed — a customer's payment behavior, a vendor's billing cycle, or a new cost that was not in the model.
KPIs to track weekly
- Tightest week closing balance vs. minimum floor
- Cumulative shortfall (sum of all weeks below floor)
- DSO (days sales outstanding) trend: rising DSO means AR is slowing
- DPO (days payable outstanding) trend: rising DPO means you are stretching vendors
- Variance magnitude vs. variance timing: a timing miss corrects itself; a magnitude miss requires a model update
Red flags that require immediate action
- Closing balance in any week drops within 10% of the minimum floor
- Two consecutive weeks of magnitude misses on AR (not timing misses)
- A single customer represents more than 30% of projected receipts in any week
- Payroll and a large tax deposit land in the same week with no buffer
Covenant monitoring
Banks and lenders commonly request 13-week forecasts for covenant monitoring or credit discussions; use the standard format when engaging lenders. If your credit agreement includes a minimum liquidity covenant, map the covenant threshold directly onto your closing balance row. Any week where the projected balance approaches that threshold is a conversation you need to have with your lender before the week arrives, not after.
A short reporting format for the CFO or board: state the tightest week number, the tightest week balance, the runway count, and the top two risks. Four lines, no narrative required.
What should a 13-week cash flow template include?
A spreadsheet template is the right starting point for most teams. The minimum feature set is not complicated, but missing any one of these elements will cost you credibility with a lender or board.
Minimum template requirements:
- Opening balance reconciliation tab (bank balance, not book balance)
- AR schedule with invoice-level collection week assignment
- AP schedule with vendor-level payment week assignment
- Payroll schedule with exact pay dates and employer tax dates
- Fixed overhead schedule (rent, insurance, subscriptions)
- Debt service schedule (principal and interest by due date)
- Net cash flow row and rolling closing balance row
- Variance tracker (projected vs. actual, week by week)
- Scenario toggle (shift AR timing, shift AP timing)
- Assumptions register (locked tab documenting scope and key inputs)
Excel mechanics that save time
Named ranges make the roll-forward formulas readable and reduce formula errors. A range named OpeningBalance_W1 is easier to audit than ='Data'!C4. Use SUMIF to pull AR collections from the invoice-level schedule into the weekly summary. Use OFFSET or a simple copy-paste macro to shift the window forward each week.
Separate your data ingestion tabs (bank, AR, AP) from the summary tab. This keeps the model auditable: anyone can trace a number from the summary back to its source in three clicks. A locked assumptions tab preserves the audit trail of changes, which matters when a lender asks why week 8 changed between submissions.
Professional templates that include invoice-level AR scheduling and built-in variance trackers accelerate trust-building with lenders and boards.
When to move beyond a spreadsheet
A spreadsheet works well for a single entity with a stable AR base. It starts to break down when you have multiple entities, more than 50 open invoices per week, or a team of more than two people updating the model. At that point, the manual data pulls, formula maintenance, and version control become the bottleneck, not the analysis.
Dedicated cash flow forecasting software connects directly to your bank and accounting system, eliminates the weekly data pull, and flags variance automatically. The trade-off is license cost and setup time. For most teams, the break-even point is when the weekly update takes more than two hours or when a model error has caused a real decision problem.
Who owns the 13-week forecast, and how often should it update?
Governance is what separates a model that gets used from one that sits in a shared drive. The TWCF needs clear ownership at every step.
Role definitions:
- Treasury owner: — Responsible for the weekly update, variance analysis, and scenario modeling. Usually the controller, CFO, or fractional CFO.
Weekly meeting cadence
The weekly cash review should take 30 minutes or less. A tight agenda:
- Reconcile opening balance to bank (5 minutes)
- Review prior week variance: timing or magnitude? (10 minutes)
- Confirm tightest week and runway count (5 minutes)
- Identify any red flags requiring action this week (5 minutes)
- Assign action items and set next update time (5 minutes)
Pro Tip: Keep a variance log as a running tab in the model. Each week, record the projected vs. actual for every major line item and note the reason for any miss above $10,000. After four weeks, patterns emerge that let you tighten your collection timing assumptions and reduce forecast error.
Worked example: how one missed payment changes everything
Here is a short numeric walkthrough that shows why the tightest week matters more than the average.
Base case assumptions:
- Week 1 opening balance: $220,000
- Weekly AR collections: $110,000 (steady)
- Weekly disbursements: $105,000 (payroll $60,000, AP $35,000, overhead $10,000)
- Week 5 has an additional $45,000 tax deposit
- Minimum cash floor: $80,000
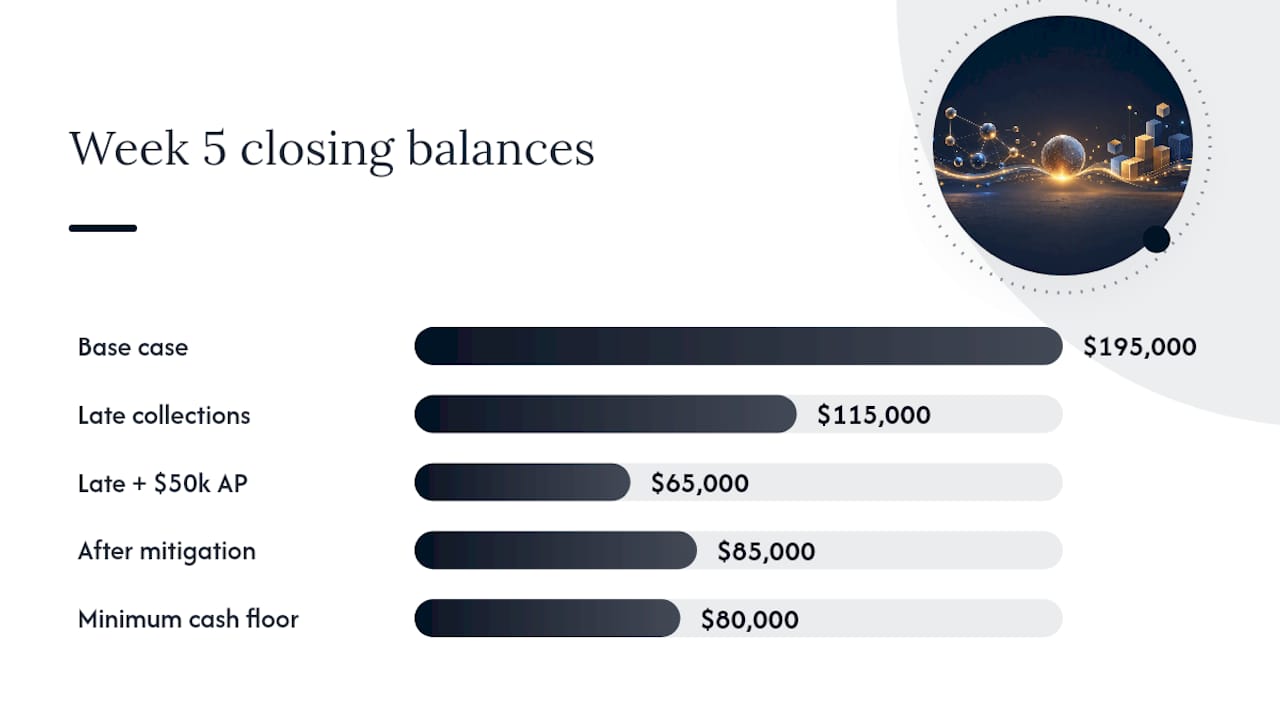
In the base case, the Week 5 closing balance is $220,000 + (4 × $5,000 net) − $45,000 = $195,000. Comfortable.
Now shift the largest AR customer (representing $40,000 of the weekly $110,000) two weeks late. Collections in weeks 3 and 4 drop to $70,000 each. The Week 5 opening balance is now $220,000 + $5,000 + $5,000 − $35,000 − $35,000 = $160,000 before the tax deposit. After the $45,000 deposit: $115,000. Still above the floor, but the cushion has shrunk from $115,000 to $35,000.
Add one more wrinkle: a $50,000 AP batch also due in Week 5. Closing balance: $115,000 − $50,000 = $65,000. That is $15,000 below the $80,000 floor.
The mitigation: call the large AR customer and negotiate a partial payment in Week 4 ($20,000 of the $40,000). Closing balance in Week 5 becomes $85,000. Floor breach avoided.
This is exactly the kind of analysis that takes 10 minutes in a well-built model and two hours in a spreadsheet without proper roll-forward formulas.
Working-capital roll-forwards and variance analysis are core to building a credible 13-week model. Teams that skip the variance step end up with a model that drifts further from reality each week instead of converging.
Automation shortens the update cycle materially. When bank feeds and AR/AP data flow directly into the model, the weekly data pull drops from 45–60 minutes to near zero. Scenario toggles that previously required manual formula edits become single-cell inputs. Variance reporting that used to require a separate analysis tab is generated automatically. The result is a team that spends its 30-minute weekly review making decisions rather than cleaning data.
Peregrine's QuickBooks Online integration handles exactly this: bank feeds, AR/AP imports, anomaly detection, and plain-English queries against the live forecast. You can ask "what is my tightest week if collections slip by two weeks?" and get an answer without touching a formula.
Key Takeaways
A disciplined 13-week cash flow forecast, updated weekly with direct-method inputs and variance tracking, is the single most effective tool for preventing a cash-driven business failure.
| Point | Details |
|---|---|
| Start with the bank balance | Always reconcile to the cleared bank balance, not the general ledger, before building the model. |
| Map AR and AP to actual payment dates | Use historical days-to-pay for AR and realistic payment dates for AP — not invoice due dates. |
| Track tightest week every cycle | The lowest closing balance across 13 weeks is your primary risk indicator; monitor it weekly. |
| Run at least two stress scenarios | Model AR slippage and a tax/payroll collision every quarter to size your real cash cushion. |
| Peregrine automates the weekly update | Peregrine connects to QuickBooks Online to handle bank feeds, variance tracking, and scenario modeling without manual data pulls. |
How finance teams actually use the 13-week model
The teams that get the most from a TWCF are not the ones with the most sophisticated model. They are the ones with the most consistent routine.
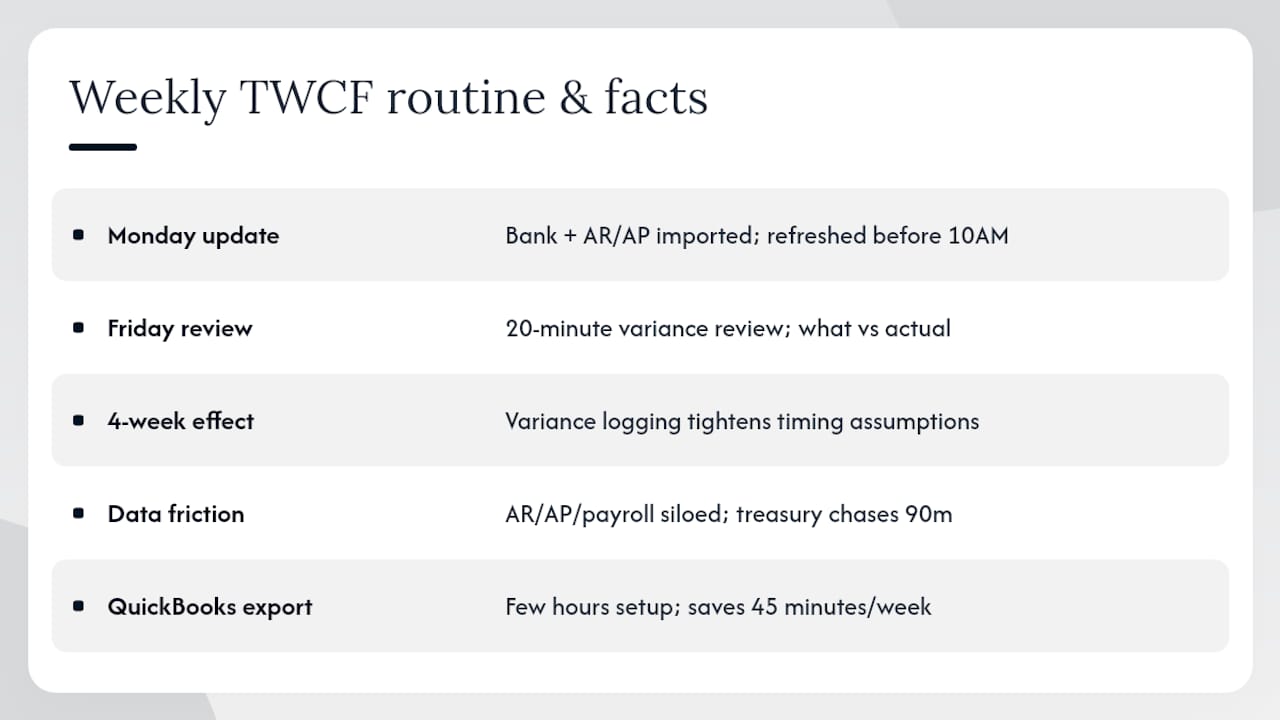
Monday morning updates are the heartbeat. The controller or CFO pulls the bank balance, imports the AR and AP aging, and has a refreshed forecast before the 10 AM stand-up. Friday is variance review: what did we project, what actually happened, and why? That 20-minute Friday session is where the model gets smarter. After four weeks of variance logging, collection timing assumptions tighten, and the model starts to feel less like a guess and more like a reliable instrument.
The organizational friction is real, though. The most common sticking point is data ownership. AR lives in one system, AP in another, payroll in a third. Getting three different people to supply clean exports on Monday morning requires a governance conversation that most teams skip. The result: the treasury owner spends 90 minutes chasing data instead of analyzing it.
ERP integration solves this, but it takes setup time. The practical middle ground for most small and mid-size businesses is a QuickBooks Online export that feeds a well-structured template. That setup takes a few hours to configure and saves 45 minutes every week thereafter.
The escalation question — when to move from a spreadsheet to dedicated software — usually answers itself. When the weekly update takes more than two hours, when a formula error has caused a real decision problem, or when a lender asks for a model that a spreadsheet cannot produce cleanly, the case for automation is already made. The teams that wait for a crisis to make that move tend to make it under pressure, which is the worst time to change tools.
Peregrine cuts the manual work out of your weekly forecast

Building and maintaining a 13-week cash flow forecast manually is entirely doable. The problem is the 60–90 minutes of data pulling, formula checking, and variance logging that happens before any actual analysis. That is the time Peregrine removes.
Peregrine connects directly to QuickBooks Online, pulling live bank balances, AR aging, and AP aging automatically. The weekly roll-forward updates without a manual data import. Anomaly detection flags unusual transactions before they distort the forecast. Scenario modeling runs through plain-English queries: ask what your tightest week looks like if a key customer pays two weeks late, and the model updates instantly.
For finance teams managing multiple entities or fractional CFOs serving several clients, Peregrine's multi-client dashboard means one place to monitor every forecast, every week. No version control issues, no emailed spreadsheets, no formula audits.
Start a 14-day free trial at Peregrine and connect your first QuickBooks Online entity in minutes.
Further reading and source list
The sources below were used to build this guide. Each one is worth bookmarking for deeper study.
- 13-Week Cash Flow Model (TWCF) | CBH Insights
- What Is 13-Week Cash Flow Forecasting? | Ripple Treasury
- 13-Week Cash Flow Model (TWCF) | Wall Street Prep
- Free 13-Week Cash Flow Forecast Template + Calculator | Transformance
- 13-Week Cash Flow Forecast: Step-by-Step | BlackpeakCFO
- How to Build a 13-Week Cash Flow Forecast | Slash
A note on perspective
The 13-week cash flow model is one of those tools that looks simple on paper and reveals its depth only after you have run it for a few weeks. The first version is always wrong in the details. The fifth version, after four rounds of variance logging and assumption updates, starts to feel like a real instrument.
The mistake most teams make is treating the TWCF as a deliverable rather than a process. They build it for a lender, submit it, and stop updating it. That is exactly backwards. The value is in the weekly discipline: the Monday update, the Friday variance review, the scenario that gets run before a big decision. A forecast that is two weeks stale is not a forecast — it is a historical document with a future date on it.
The other underappreciated point: the model does not need to be perfect to be useful. Treasury practitioners describe the TWCF as a living operational tool that is "wrong" in absolute precision but "right" in direction. A model that correctly identifies your tightest week within $20,000 is good enough to make the decisions that matter. Chasing the last dollar of precision at the cost of the weekly update cadence is the wrong trade-off.