
The cash conversion cycle (CCC) measures how many days your cash stays locked in operations before it comes back to you. The formula is simple: CCC = DIO + DSO − DPO. Days Inventory Outstanding plus Days Sales Outstanding minus Days Payable Outstanding. A shorter CCC means faster cash recovery and less pressure on working capital. A longer one means you're financing your own operations, often with debt.
Changes in CCC flow directly through free cash flow via delta net working capital — shorten the cycle and you release cash; let it lengthen and you consume it. That connection is why CCC belongs in every monthly close review, not just annual planning.
Three immediate steps worth taking now:
- Calculate your current CCC using average beginning and ending balances for inventory, accounts receivable, and accounts payable rather than ending balances alone.
- Benchmark the result against close industry peers using a source like GuruFocus's CCC data — there is no universal "good" number.
- Pick one lever to test this quarter: tighten AR collections, reduce slow-moving inventory, or negotiate extended supplier payment terms.
Key Takeaways
A shorter cash conversion cycle directly improves free cash flow by releasing cash tied up in inventory and receivables, making CCC one of the most actionable working-capital metrics a finance team can track.
| Point | Details |
|---|---|
| CCC formula | CCC = DIO + DSO − DPO; use average balances and COGS-based denominators for DIO and DPO, credit sales for DSO. |
| No universal benchmark | Compare CCC to close industry peers and your own rolling 12-month trend, not a generic target. |
| Three improvement levers | Reduce DIO (forecasting, JIT), reduce DSO (billing automation, credit policy), increase DPO (supplier negotiation, supply-chain finance). |
| Pair CCC with profitability | Optimizing CCC in isolation can harm margins or supplier relationships; review alongside ROE and gross margin. |
| Peregrine automates monitoring | Peregrine pulls QuickBooks Online data to calculate CCC automatically, flag anomalies, and run scenario tests in real time. |
Table of Contents
- How to calculate the cash conversion cycle step by step
- A worked example: from raw balances to final CCC
- How to interpret your CCC and benchmark it against peers
- Operational levers to shorten your cash conversion cycle
- Building a CCC dashboard that actually drives decisions
- Common CCC mistakes and how to fix them fast
- A finance team's view: governance, ownership, and real decisions
- Peregrine automates CCC tracking so you can focus on the levers
- Sources
How to calculate the cash conversion cycle step by step
The CCC formula has three components, each with its own balance-sheet inputs and denominator logic. Getting those details right matters more than most guides admit.
The three component formulas
DIO (Days Inventory Outstanding) DIO = (Average Inventory ÷ COGS) × 365
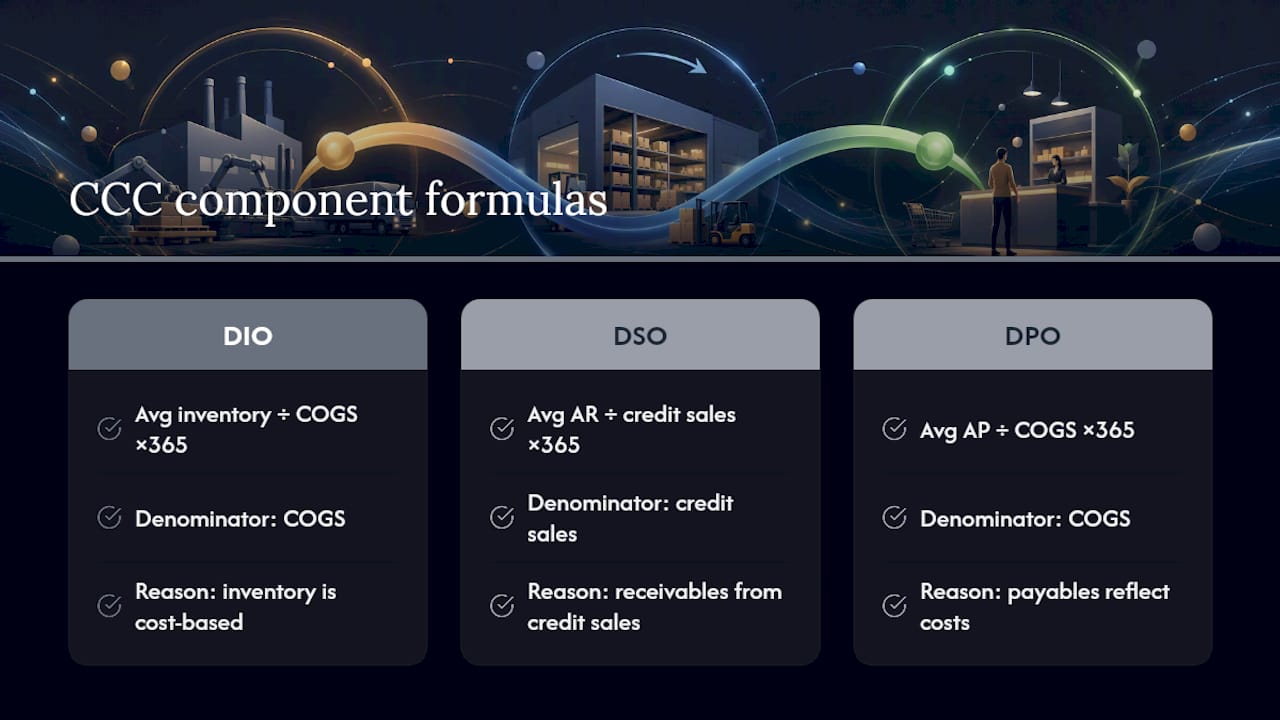
DSO (Days Sales Outstanding) DSO = (Average Accounts Receivable ÷ Credit Sales) × 365
DPO (Days Payable Outstanding) DPO = (Average Accounts Payable ÷ COGS) × 365
The CFI's CCC guide is explicit about denominator choice: use COGS in DIO and DPO because inventory and payables are cost-based items. Use credit sales for DSO because receivables arise from credit transactions, not total revenue. Mixing those denominators distorts every component.
The matching principle and day-count choices
Average balances matter because you're dividing a stock (a balance) by a flow (an annual rate). Using only the ending balance ignores how the balance moved during the period. The standard approach: use average balances such as the mean of beginning and ending balances.
For the day-count denominator, J.P. Morgan's CCC guidance recommends 365 for annual data. For quarterly analysis, use the actual days in the quarter (90 or 91) or 360/4 = 90. For monthly work, use the actual days in the month. Inconsistent denominators create artificial trend swings that look like operational changes but are just math artifacts.
When credit sales data isn't available
Many smaller businesses don't separate credit and cash sales in their reporting. If that's your situation, document the substitution and run a sensitivity check. Using total revenue instead of credit sales understates true DSO whenever cash sales are material — the gap can be several days in a mixed business. Flag it in your reporting so stakeholders know the DSO figure has a ceiling.
Key calculation gotchas
- Using ending balances instead of averages (overstates or understates depending on seasonality)
- Mixing cash-basis and accrual-basis figures in the same calculation
- Applying annual COGS to a quarterly AR balance without adjusting the denominator
- Ignoring seasonal inventory builds that inflate DIO at certain reporting dates
Pro Tip: For businesses with heavy seasonality — retail before the holidays, for example — calculate CCC at the same point each year for trend comparisons, or use a rolling 12-month average to smooth the distortion. A single December snapshot will look nothing like a June one, and neither tells the full story alone.
A worked example: from raw balances to final CCC
Here's a concrete cash conversion cycle example using a mid-size manufacturer with annual data.
Sample data
Step-by-step calculation
- DIO = ($4,500,000 ÷ $18,000,000) × 365 = 91.3 days
- DSO = ($2,300,000 ÷ $24,000,000) × 365 = 35.0 days
- DPO = ($1,500,000 ÷ $18,000,000) × 365 = 30.4 days
- CCC = 91.3 + 35.0 − 30.4 = 95.9 days
Excel / Google Sheets formulas
Assuming your data is in a table with averages in column C and annual figures in column D:
=( C2 / D_COGS ) * 365→ DIO=( C3 / D_CreditSales ) * 365→ DSO=( C4 / D_COGS ) * 365→ DPO= DIO + DSO - DPO→ CCC
For quarterly work, replace 365 with the actual days in the quarter (e.g., 91 for Q1).
What 95.9 days means — and a quick sensitivity check
This manufacturer waits roughly 96 days from the moment it pays for raw materials to the moment it collects from customers. That's nearly a full quarter of cash tied up in the operating cycle. If the AR team tightened collections and cut DSO by 10 days, CCC drops to 85.9 days — a direct, dollar-for-dollar improvement in free cash flow. On $24 million in credit sales, 10 days of DSO reduction releases roughly $657,000 in cash ($24M ÷ 365 × 10).

How to interpret your CCC and benchmark it against peers
A CCC number means nothing in isolation. Context is everything.
What low, high, and negative CCC values signal
A low CCC typically indicates the business converts inventory and receivables into cash quickly, which reduces the need for short-term borrowing and gives management more flexibility. Investopedia's CCC explainer notes that a shorter cycle is generally better because it means faster conversion of working capital into cash — and a negative CCC can occur when a company collects from customers before it pays suppliers.
A negative CCC is not a red flag. It's a structural advantage for businesses with strong bargaining power or prepaid revenue models. Large retailers with dominant supplier relationships can routinely run negative cycles because they sell inventory before the supplier invoice comes due. The risk is that this model depends on maintaining that leverage — lose it, and the cycle flips fast.
A high CCC signals cash is sitting in inventory or waiting in receivables longer than it should. That's not always a crisis, but it does mean the business is self-financing its operations, often at a cost.
Industry benchmarks and why peer comparison matters
GuruFocus's CCC benchmarking data makes the point clearly: there is no universal "good" CCC. Retail and FMCG companies often run short or sometimes negative cycles due to quick inventory turnover and fast collections. Manufacturing and project-based businesses typically operate with longer cycles reflecting extended production and payment terms.
Comparing a manufacturer's 95-day CCC to a grocery chain's negative CCC tells you nothing useful. Compare it to other manufacturers in the same segment, then track the trend over 12–24 months.
- Retail / FMCG: Often 0–30 days, sometimes negative
- Manufacturing: Typically 60–120+ days depending on production complexity
- Services (no inventory): DSO-driven; DIO is zero or near-zero
- SaaS / subscription: CCC is often not the right metric; cash runway and CAC payback period are more relevant
Pro Tip: Use a rolling 12-month CCC rather than a single-period snapshot. Seasonal inventory builds, holiday AR spikes, and year-end payables timing all distort point-in-time readings. A rolling figure smooths those effects and gives you a cleaner trend signal.
Operational levers to shorten your cash conversion cycle
J.P. Morgan's framework organizes CCC improvement around three levers: reduce inventory days, reduce receivables days, and extend payables days. Each lever has real trade-offs. Pulling one without understanding the others is how companies create new problems while solving old ones.
Reducing DIO (Days Inventory Outstanding)
- Demand forecasting. Replace static reorder points with rolling demand forecasts tied to sales data. Better forecasts mean less safety stock and fewer slow-moving SKUs sitting on shelves.
- JIT (just-in-time) replenishment. Order closer to actual need rather than in bulk. Works best when supplier lead times are short and reliable.
- SKU rationalization. Identify the bottom 20% of SKUs by velocity and margin. Discontinuing or consolidating them reduces carrying costs and frees warehouse cash.
Trade-offs: Leaner inventory raises stockout risk. Run the numbers before cutting.
Reducing DSO (Days Sales Outstanding)
- Billing automation. Send invoices the day goods ship or services are delivered, not at month-end. Delayed billing is delayed cash.
- Early-pay discounting. A 1%/10 net 30 term (1% discount if paid within 10 days) can pull collections forward significantly for customers who value the discount.
- Tighter credit policies. Review customer credit limits quarterly. Customers consistently paying at 60+ days on net-30 terms are financing themselves with your cash.
- AR aging reviews. Weekly aging bucket reviews catch slow payers before they become write-offs.
Trade-offs: Aggressive collections can strain customer relationships, particularly in B2B markets where long-term contracts matter more than a few days of DSO. Early-pay discounts cost real margin — calculate the annualized cost before offering them broadly.
Increasing DPO (Days Payable Outstanding)
- Negotiate extended terms. Ask for net-45 or net-60 where net-30 is standard. Many suppliers will agree, especially for high-volume buyers.
- Supply-chain finance programs. These let suppliers get paid early (by a bank or fintech) while you pay on extended terms. Both sides benefit.
- Centralize payables approval. Decentralized approvals often result in early payments by default. A centralized process captures the full term.
Trade-offs: Pushing DPO too hard strains supplier relationships and can result in less favorable pricing, reduced priority during supply crunches, or shorter credit terms in the next contract cycle. Farseer's CCC analysis notes that supplier negotiation works best when it's positioned as a partnership rather than a squeeze.
Implementation checklist
- Identify which component (DIO, DSO, or DPO) has the largest gap versus peers.
- Run a 30-day pilot on one tactic (e.g., automated invoice dispatch).
- Measure ΔCCC at the end of the pilot, alongside stockout rate, customer payment complaints, and supplier feedback.
- Expand what works; abandon what doesn't before moving to the next lever.
Pro Tip: Cross-functional governance is the hidden variable. Sales teams resist tighter credit policies because they fear losing deals. Procurement resists extended terms because they want supplier goodwill. Finance needs to own the CCC target and present the working-capital math to both teams — in dollars, not days — to get alignment.
Building a CCC dashboard that actually drives decisions
Spreadsheets can calculate CCC. They struggle to monitor it in near real time, flag anomalies, or run scenario tests without hours of manual rework. Wall Street Prep's CCC guide makes the case that automated calculations reduce spreadsheet errors and enable scenario testing that static models can't match.
Minimum data feeds for a reliable CCC dashboard
A cash conversion cycle dashboard needs four live data streams:
- Daily cash and bank balances — for liquidity context alongside CCC
- AR aging by customer and bucket — to catch DSO deterioration early
- AP aging and upcoming due dates — to monitor DPO without missing payment terms
- Inventory snapshots by SKU or category — updated at least weekly, daily for fast-moving goods
Without these feeds, the dashboard is just a lagging report dressed up as a live view.
What a compact CCC dashboard should show
| Dashboard Element | Purpose |
|---|---|
| Current period CCC (vs prior period) | Instant trend signal |
| 12-month rolling CCC trend line | Removes seasonal distortion |
| DIO / DSO / DPO component breakdown | Pinpoints which lever is moving |
| AR aging buckets (current, 30, 60, 90+ days) | Early warning on collections |
| Scenario toggle (e.g., DSO −5 days) | Tests improvement levers without manual rework |
Implementation steps for automation
- Connect your accounting system (QuickBooks Online, NetSuite, or similar) to your FP&A or cash-management tool via API or native integration.
- Define clean mapping rules: separate credit sales from cash sales, map inventory accounts correctly, and align COGS to the right cost centers.
- Set a calculation cadence — weekly for operational monitoring, monthly for formal reporting.
- Build escalation triggers: if CCC rises more than 7 days from the prior period, flag it for the next finance review.
Pro Tip: Anomaly detection is where automation earns its keep. Automated alerts on those thresholds short-circuit the reactive borrowing cycle that many businesses fall into when cash gets tight. For a deeper look at cash flow forecasting software that supports this kind of monitoring, the options have expanded considerably.
Common CCC mistakes and how to fix them fast
Most CCC errors fall into two categories: calculation mistakes that produce wrong numbers, and analytic mistakes that produce wrong conclusions from correct numbers.
Calculation mistakes
- Using ending balances. A December 31 inventory balance reflects holiday stock builds, not a typical operating level. Always average beginning and ending balances. For quarterly work, use the quarter's opening and closing balances.
- Wrong DSO denominator. Using total revenue instead of credit sales overstates the denominator and understates DSO. If a business does 30% cash sales, the true DSO could be meaningfully higher than the blended figure suggests. CFI's guidance is clear: use credit sales where available, and document any substitution.
- Mixing cash and accrual flows. If your AR balance is accrual-based but your sales figure is cash-receipts-based, the ratio is comparing apples to oranges. Align both to the same accounting basis.
- Inconsistent day-count denominators. Using 365 for a quarterly analysis inflates the result by roughly 4×. Match the denominator to the period.
Analytic mistakes
- Cross-industry benchmarking. A 90-day CCC is fine for a capital equipment manufacturer and alarming for a grocery distributor. Compare only to close peers.
- Ignoring seasonality. A single snapshot CCC at a seasonal peak looks nothing like the annual average. Use rolling figures or compare the same period year-over-year.
- Treating CCC in isolation. A company can shorten its CCC by cutting inventory so aggressively that margins collapse on rush orders, or by extending payables so far that suppliers raise prices. J.P. Morgan recommends pairing CCC analysis with profitability metrics like ROE and gross margin to avoid optimizing one number at the expense of the business.
A finance team's view: governance, ownership, and real decisions
The CCC formula is straightforward. The governance around it is where most finance teams fall short.
In practice, a monthly CCC review at close should be standard. Each component needs an owner: sales or AR teams own DSO, operations or supply chain owns DIO, and procurement owns DPO. Without clear ownership, CCC becomes a metric everyone monitors and nobody moves.
Escalation triggers matter. A shift of more than 5–7 days in a single period warrants a cross-functional conversation, not just a note in the board pack. That conversation should answer three questions: which component drove the change, what caused it operationally, and what's the corrective action with a timeline.
Translating CCC into funding decisions is where finance adds real value. A rising CCC that's structural (longer customer payment terms in a new market segment, for example) may justify a revolving credit facility. A rising CCC that's operational (slow collections, excess safety stock) calls for process fixes, not more debt. The distinction matters enormously for capital allocation. Finance teams that track CCC alongside free cash flow and broader cash flow improvement strategies are better positioned to make that call quickly.
A governance pattern worth adopting: monthly CCC review at close, quarterly cross-functional deep dive for any shift greater than 5–7 days, and a standing pilot program to test one lever per quarter with predefined success criteria. That cadence keeps the metric alive without turning every close into a working-capital crisis meeting.
Peregrine automates CCC tracking so you can focus on the levers
Calculating CCC manually each month is manageable. Monitoring it weekly, running scenario tests, and catching anomalies before they compound — that's where spreadsheets break down.

Peregrine connects directly to QuickBooks Online and pulls the AR, AP, inventory, and COGS data needed to calculate CCC automatically, without manual exports or formula maintenance — see the Dividend Tracker — Executed, Declared, Estimated · Evibe for tracking event-driven cash adjustments in complex cash flow models. The real-time dashboard shows current CCC, the 12-month rolling trend, and component-level breakdowns — the same structure described in the monitoring section above. Scenario toggles let you test a 5-day DSO reduction or a 10-day DPO extension and see the cash impact instantly. Anomaly detection flags AR aging spikes and inventory day jumps before they show up in the monthly close, cutting the reactive borrowing cycle that drains cash from growing businesses. Finance leaders at small businesses and accounting firms use Peregrine to get CFO-grade working-capital visibility without building a custom dashboard from scratch. Start a Theperegrine and have your first automated CCC report running within the same week.
Sources
The sources below are worth bookmarking for different stages of CCC work:
- Understanding & Optimizing Your Cash Conversion Cycle (CCC)
This article is general information, not a substitute for advice from a qualified financial advisor. Consult a qualified financial professional about your own circumstances before acting on anything here.