
A high-impact board report is a one-page executive summary (BLUF), followed by concise dashboards, and a clear "Asks of the Board" section. That structure is the whole game. Your mandatory checklist: executive summary → financial snapshot → strategic initiatives → top risks → governance highlights → explicit asks. Governance resources like the Ivey Business Journal and Diligent both converge on this spine, and Peregrine automates the data layer underneath it.
One-line checklist: BLUF (1 page) + KPI snapshot + initiative status + top 3 risks + explicit asks = a board report that drives decisions, not just discussion.
Table of Contents
- What sections does every board report need?
- A copyable board report example you can use today
- How should you display KPIs and financials for directors?
- How AI tools speed up board report preparation
- Who does what, and when, before a board meeting?
- Common mistakes that undermine board reports
- Key Takeaways
- Why the format matters more than the content
- Peregrine cuts board report prep from days to hours
- Useful sources and further reading
What sections does every board report need?
A well-structured board report follows a canonical format that directors can scan in minutes. Each section has a specific job.
- Executive summary (BLUF): One page maximum. The Ivey Business Journal recommends five or six candid key points with hyperlinks to deeper materials. This is what directors read first.
- Financial performance snapshot: Headline KPIs with variance to plan, not raw tables. Revenue, EBITDA, cash position, and runway belong here. Full financials go in the appendix.
- Strategic initiatives and progress: Status (on track / at risk / off track) plus one-sentence next steps per initiative. No narrative essays.
- Risk and opportunity analysis: Top three risks, likelihood/impact rating, and the mitigation in plain language.
- Governance and compliance highlights: Regulatory updates, audit status, committee summaries. One paragraph is usually enough.
- Decisions / Asks of the Board: Label every item as "Decision required," "Advice requested," or "For information." Ambiguity wastes meeting time.
- Appendix: Granular dashboards, full financials, supporting data. No page limit here.
Keep the main narrative to six pages or fewer and push everything else to the appendix. That rule alone separates decision-ready reports from information dumps.
A copyable board report example you can use today
Paste this structure into Word, Google Docs, or a slide deck and replace the bracketed fields.
BOARD REPORT — [Organization Name] | [Q/Month YYYY] Prepared by: [Name, Title] | Submitted: [Date] | Board Meeting: [Date]
1. Executive Summary [One-line status: e.g., "Q1 closed above plan on revenue; cash runway extended to 18 months."]
- Most important development: [e.g., new enterprise contract signed, $2.4M ARR]
- Key challenge: [e.g., gross margin compressed 3 pts due to vendor price increases]
- Critical decision this meeting: [e.g., approve Series B term sheet]
2. Financial Snapshot Revenue: $[X] vs. $[Budget] | Variance: +/- $[X] ([%]) — [one-line explanation] EBITDA: $[X] vs. $[Budget] | Variance: +/- $[X] ([%]) — [one-line explanation] Cash on hand: $[X] | Runway: [X months] Full financials attached.
3. Strategic Initiatives
- Initiative A: [On Track] — [Progress note]. Next milestone: [Date]
- Initiative B: [At Risk] — [Progress note]. Next milestone: [Date]
4. Top Risks
- Risk 1: [Description] | Likelihood: H | Impact: H | Mitigation: [Action]
- Risk 2: [Description] | Likelihood: M | Impact: H | Mitigation: [Action]
- Risk 3: [Description] | Likelihood: L | Impact: M | Mitigation: [Action]
5. Governance Highlights [Audit status, compliance update, committee summary — 2–3 sentences.]
6. Asks of the Board
- ☐ Decision required: [What the board must approve] — Recommended by [Name/Role]
- ☐ Advice requested: [Topic for discussion]
- ☐ For information: [Update requiring no action]
Supporting materials attached to board pack.
"The most common mistake is treating the board report as an information dump. It must be a strategic decision tool with clear asks — otherwise you waste the meeting." — Ivey Business Journal governance guidance
How should you display KPIs and financials for directors?
Directors should not have to do mental math. One metric per visual, directional arrows showing velocity, and consistent scales quarter over quarter. That is the standard.
| KPI | Recommended visual | When to use arrows |
|---|---|---|
| Revenue (monthly/quarterly) | Trend line | Always — show direction vs. prior period |
| EBITDA variance to plan | Waterfall chart | When explaining positive and negative drivers |
| Cash runway | Single KPI tile | Arrow up/down vs. prior quarter |
| Gross margin | Trend line | Flag compression or expansion |
| Burn rate | Bar chart (monthly) | Arrow when trend changes direction |
| NRR / GRR (SaaS) | KPI scorecard | Arrow vs. prior period and vs. target |
A sample financial table from Deckary illustrates the layout well: three headline rows (Revenue $18.2M, EBITDA $4.1M, Cash $14.8M) with variance columns beside each figure. That format lets a director scan the whole snapshot in under 30 seconds.

Formatting rules that matter: minimum 12-point sans-serif font on slides, left-justified text, and color used only to signal status (green = on track, amber = at risk, red = off track). Never use color purely for decoration.
How AI tools speed up board report preparation
Manual report prep typically means three days of data pulls, formatting fixes, and last-minute variance rewrites. AI-driven platforms cut that cycle significantly by automating the consolidation and narrative layers.
Implementation steps for connecting an AI reporting tool:
- Connect your accounting system. For QuickBooks Online users, Peregrine links directly and pulls actuals in real time, eliminating the manual export step.
- Map your KPIs. Define which accounts roll up to revenue, EBITDA, and cash runway so the dashboard reflects your chart of accounts.
- Configure dashboard templates. Set the layout once: KPI tiles, trend charts, variance columns. The format stays consistent every reporting cycle.
- Enable anomaly detection. Peregrine flags unusual transactions or unexpected variances before they reach the board, giving finance teams time to investigate rather than explain surprises live.
- Set up narrative templates. Pre-built variance sentence structures (e.g., "Revenue came in $[X] above plan, driven by [driver]") let the AI draft the explanation; your team reviews and approves.
- Configure "Asks of the Board" prompts. Template the decision, advice, and information labels so nothing gets left ambiguous.
The concrete benefit: AI-driven reporting automates data consolidation, maintains consistent formatting, and detects anomalies that manual processes miss. Finance teams shift from building the report to reviewing and interpreting it.
Pro Tip: Always read the AI-generated narrative before distribution. Automated variance explanations are accurate on the numbers but may miss the business context — a 5% revenue miss means something different if it's timing versus lost deals. Add one sentence of human judgment per material variance.
For teams managing month-end close automation, connecting that workflow to board reporting creates a single, validated data pipeline from close to pack.
Who does what, and when, before a board meeting?
| Milestone | Timing | Owner |
|---|---|---|
| Data cut and draft dashboards | T-14 days | Finance / Accounting |
| Draft narrative and Asks | T-7 days | CFO / Finance lead |
| Internal review and revisions | T-4 days | CEO + CFO |
| Final sign-off | T-3 days | CFO |
| Distribute board pack | 5–7 days before meeting | Board Secretary |
Before the pack goes out, run this validation checklist: reconcile headline KPIs to source data, verify all variance explanations match the numbers, confirm appendix attachments are complete, and lock the version. The accounting vs. FP&A ownership split matters here: accounting owns the actuals, FP&A owns the narrative and variance analysis.
Common mistakes that undermine board reports
The biggest failure is length. A 20-page narrative with embedded tables signals that the author did not make decisions about what matters. Directors notice.
- No explicit asks: If the board cannot tell whether an item needs a vote or is just an update, the meeting drifts. Label every item.
- Surprises: A board should never hear bad news for the first time in the meeting. If a risk materialized, it belongs in the report with a mitigation already in place.
- Inconsistent formats: Changing the layout quarter over quarter forces directors to relearn where to look. Stable templates build trust faster than polished one-offs.
- Static numbers without context: A revenue figure means nothing without the prior period, the plan, and a directional arrow. Always show the trend.
- Missing variance explanations: Positive and negative variances both need one-line explanations. Unexplained outperformance is as confusing as a miss.
Pro Tip: For nonprofit board report examples or ESG-focused reports, add a non-financial KPI section after the financial snapshot. Track metrics like program outcomes, volunteer hours, or carbon intensity the same way you track revenue: actual vs. target, with a directional arrow and a one-line explanation.
Key Takeaways
A decision-focused board report leads with a one-page BLUF, uses trend visuals with directional arrows, and closes with explicit labeled asks — everything else supports those three elements.
| Point | Details |
|---|---|
| BLUF-first structure | Open every report with a one-page executive summary stating the top development, key challenge, and critical decision. |
| Explicit asks | Label every board item as "Decision required," "Advice requested," or "For information" to prevent wasted meeting time. |
| Trend visuals over static numbers | Use directional arrows and consistent scales so directors grasp velocity without doing mental math. |
| Automate the data layer | Connect QuickBooks Online to your reporting tool to eliminate manual exports and enable anomaly detection before the pack goes out. |
| Peregrine for board pack automation | Peregrine integrates with QuickBooks Online to automate KPI dashboards, variance narratives, and anomaly alerts for recurring board packs. |
Why the format matters more than the content
Most finance teams spend their energy on the numbers and almost none on the structure. That is the wrong ratio. A director reading a 15-page report with no explicit asks will remember almost none of it, regardless of how accurate the data is. The format is what makes the content usable.
The BLUF-first approach from the Ivey Business Journal is not a stylistic preference. It is a cognitive load decision. Directors arrive at board meetings having read multiple packs. The report that leads with the answer, not the context, gets read. The one that buries the key decision on page eight gets skimmed.
Consistent formatting across quarters also builds a different kind of trust than any single polished report can. When directors know exactly where to find the cash runway, the risk register, and the asks, they spend meeting time on decisions rather than orientation. Adapt the templates here for your industry, but preserve the decision-focused spine.
Peregrine cuts board report prep from days to hours
Finance teams using QuickBooks Online can connect Peregrine directly to their accounting data and generate a complete board pack, including KPI dashboards, variance narratives, and anomaly alerts, without a single manual export.
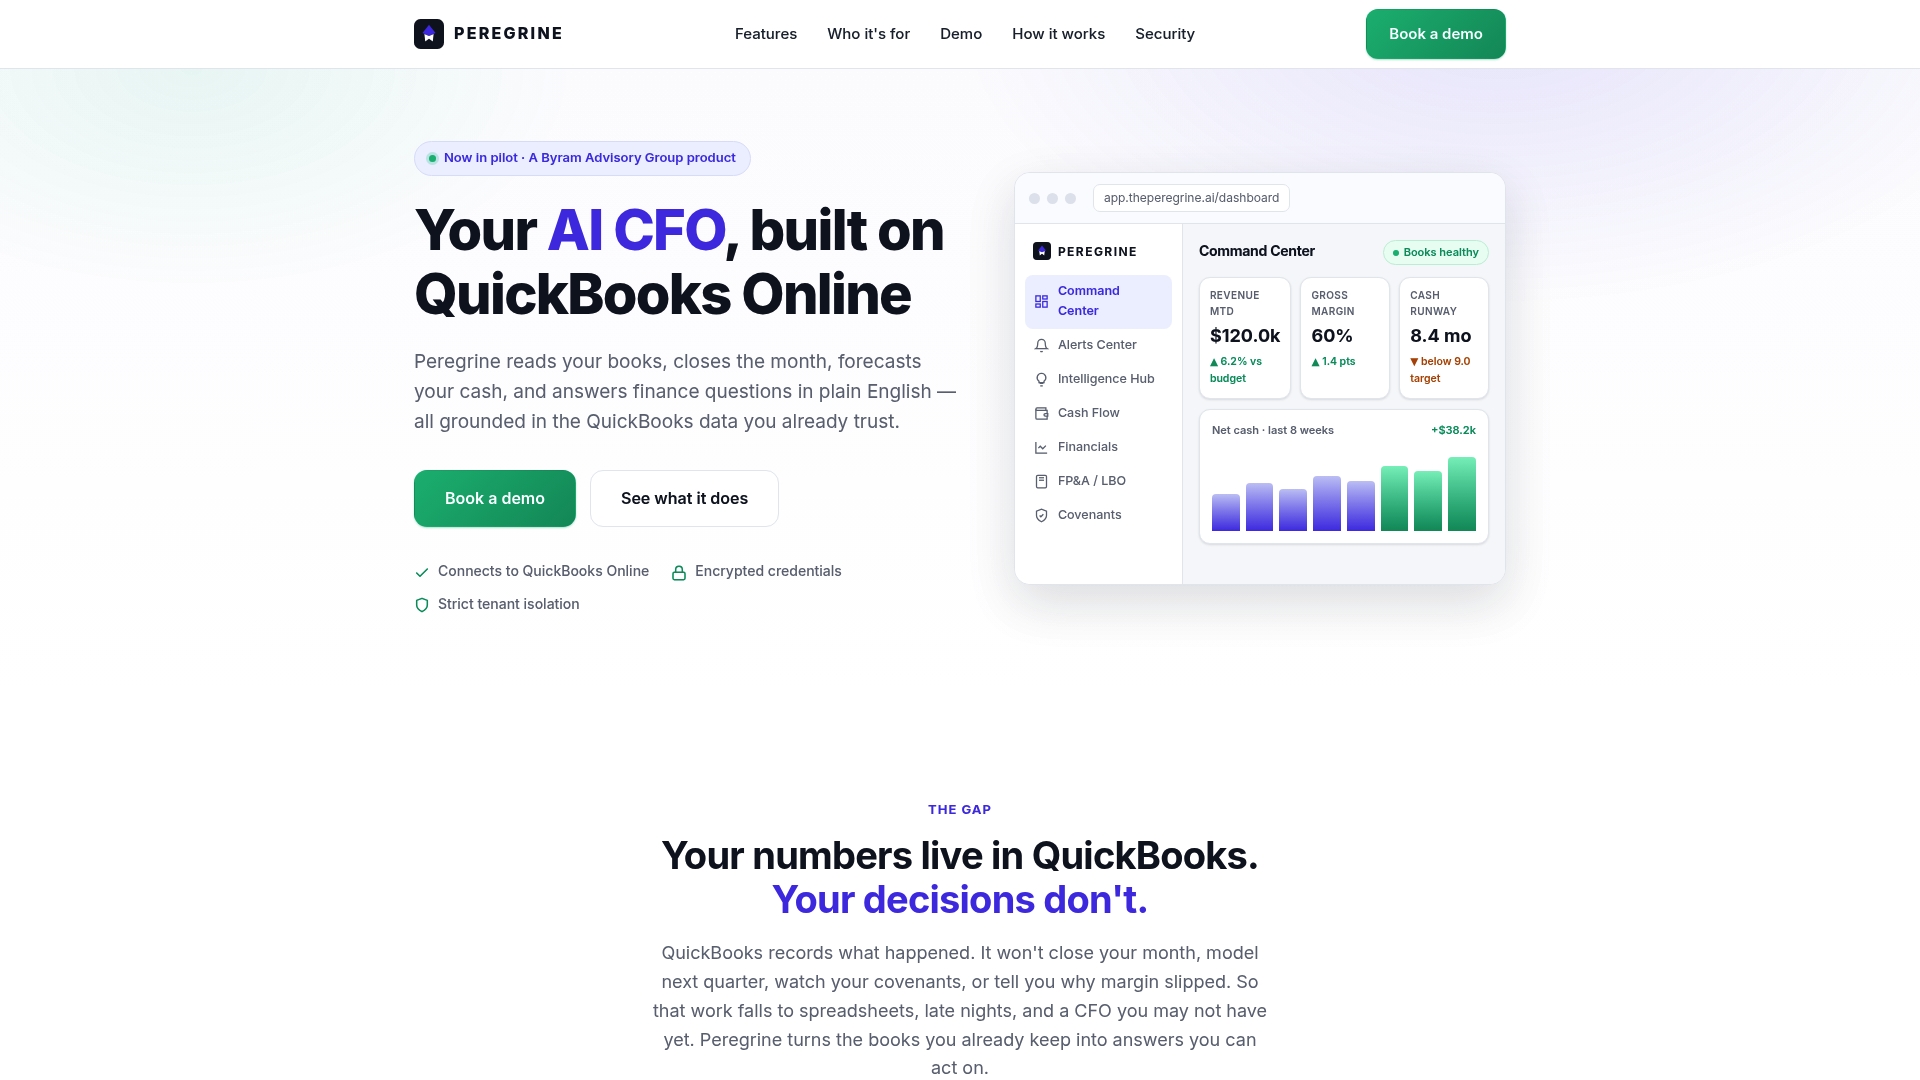
Peregrine's real-time command center pulls actuals the moment the books close, flags anomalies before they reach the board, and generates plain-English variance explanations your team reviews rather than writes from scratch. Role-based dashboards mean the CFO, CEO, and board members each see the view they need. The result: a report that used to take three days of prep takes a fraction of that time, with fewer errors and no last-minute data scrambles.
Start a 14-day free trial at Peregrine and connect your QuickBooks Online account in minutes. Implementation support is included.
Useful sources and further reading
- Ivey Business Journal — How to Report Properly to a Corporate Board: The primary governance reference for executive summary length, candor, and the BLUF-first principle. Use this when setting your report's tone and structure.
- Diligent — Board Reporting Resources: Covers AI automation benefits, consistent formatting, and anomaly detection in board reporting workflows.
- Venngage — Board Report Format, Structure, Examples and Templates: Practical format guidance with visual examples; useful for teams building their first template.
- Deckary — Board Report Template: Includes a sample financial table with KPI rows and a decisions list; good reference for the financial snapshot section.
- Pitch — How to Write a Board Report That Gets Results: Covers distribution timing (5–7 days in advance) and narrative best practices.
- AppDeck — Free Board Report Template: Source for the six-page main narrative rule and appendix guidance.
- Ivey Publishing — Board Reporting Governance Excerpt: Backs the explicit asks convention ("Decision required / Advice requested / For information") and the stable-format principle.
- BRFRapport — Board Report Examples for Finance Organizations: Seven practical report examples from finance-sector organizations; useful for teams adapting templates to cooperative or regulated-entity structures (Sweden-focused partner content).