
This page gives you a complete financial analysis report example you can adapt today: an annotated executive summary, a filled sample with KPIs and ratio tables, and downloadable Excel, Word, and PDF templates. Whether you're preparing a monthly management pack, an investor due diligence package, or a lender covenant report, the structure below maps directly to what each audience needs.
Quick-start templates by use case:
- Monthly management flash (Excel): start with the KPI dashboard tab; update revenue, COGS, and cash weekly
- Investor due diligence (Word/PDF): lead with the executive summary and three-year trend tables; attach audited statements as appendices
- Lender covenant tracking (Excel): prioritize the leverage and coverage ratio tabs; flag covenant thresholds in red conditional formatting
A financial analysis report evaluates a company's financial health by interpreting core financial statements and layering in KPIs, trend analysis, and qualitative insights. For public companies, that depth appears in annual reports or Form 10-K filings. For private businesses, the same logic applies at whatever cadence management needs.
Table of Contents
- What does a financial analysis report example actually look like?
- How do you write a financial analysis report from scratch?
- What components does every financial analysis report need?
- Which ratios and KPIs should you always calculate?
- How do KPI priorities shift by industry?
- Where can you download financial report templates?
- How long does it take to prepare a financial analysis report?
- How does Peregrine automate your financial analysis report?
- Key Takeaways
- The part most finance reports get wrong
- Get CFO-grade reports without the 40-hour build
- Useful sources and example reports
What does a financial analysis report example actually look like?
The structure below mirrors how professional sample reports are organized: executive summary first, then summarized statements, then ratio analysis, then detailed schedules in attachments. That ordering is deliberate. Readers who only need the headline answer get it on page one; analysts who need the detail find it in the back.
Annotated executive summary

That paragraph answers "so what" before the reader sees a single line item. The supporting bullets explain why the headline numbers moved.
Sample ratio table
The table below shows the six ratios every business financial report example should include, with one-line interpretations drawn from the Acme sample.
| Ratio | Formula | Acme FY 2025 | Interpretation |
|---|---|---|---|
| Current ratio | Current assets ÷ Current liabilities | 2.1x | Adequate short-term liquidity; above typical lender minimums |
| Gross margin | Gross profit ÷ Revenue | 38.2% | Compressed 180 bps YoY; monitor raw material contracts in Q1 |
| Net profit margin | Net income ÷ Revenue | 8% | Healthy for manufacturing; watch SG&A if revenue growth slows |
| Debt-to-EBITDA | Total net debt ÷ EBITDA | 2.1x | Within covenant; headroom narrows if EBITDA falls |
| Days Sales Outstanding | Accounts receivable ÷ (Revenue ÷ 365) | 7 days | Up 7 days YoY; collections process needs review |
| Asset turnover | Revenue ÷ Total assets | — | Efficient use of assets; in line with industry median |
Callout: A rising DSO alongside flat revenue is one of the earliest signals of a cash crunch. Catching it in the ratio table, before it hits the cash flow statement, is exactly why analysts run this section monthly.
Chart callouts to include
Three visuals carry most of the analytical weight in a well-built report:
- Revenue trend (bar + line): 12-month or trailing-12-month bars with a net margin line overlay. Readers see volume and profitability moving together or diverging.
- Margin waterfall: Shows the walk from gross margin to EBITDA margin, isolating where costs are consuming profit.
- Cash runway: A simple bar showing months of operating cash remaining at current burn. Critical for lenders and investors.
How do you write a financial analysis report from scratch?
Follow these steps in order. Skipping the validation step (step 3) is the most common reason a report goes back for revision.
- Define scope and audience. Decide the period (monthly, quarterly, annual), the entity (single entity or consolidated), and who will read it. A lender wants leverage ratios and covenant headroom. A board wants revenue trend and cash position. An operations manager wants margin by product line.
- Gather the four financial statements. Pull the balance sheet, income statement, cash flow statement, and statement of changes in equity from your accounting system. These four statements are the non-negotiable foundation for ratio analysis and forecasts.
- Validate the data. Reconcile the trial balance to the bank statement. Map your chart of accounts to the report's categories. Check that opening balances match the prior period's closing balances. A 10-minute reconciliation here prevents a two-hour correction later.
- Calculate ratios and KPIs. Use the formulas in the ratio section below. Calculate at minimum: current ratio, gross margin, net margin, debt-to-EBITDA, DSO, and operating cash flow.
- Write the commentary. Lead with the "so what" — what changed, why it changed, and what management should do about it. Keep each section to three to five sentences. Attach the detailed schedules; do not paste them into the narrative.
- Produce visuals. Build the three charts listed in the annotated sample above. Visuals should reinforce the commentary, not repeat it.
- Review and sign off. Have a second reviewer check ratio formulas and confirm that the executive summary matches the numbers in the body. For board or lender packs, a CFO or controller sign-off is standard.
Data sources and validation checklist:
- Trial balance exported from QuickBooks Online, NetSuite, or your ERP
- Bank statements reconciled to cash line on the balance sheet
- Accounts receivable aging report (confirms DSO calculation)
- Fixed asset schedule (confirms depreciation and net book value)
- Loan agreements (confirms covenant definitions and thresholds)
Pro Tip: Map your chart of accounts to report categories before you build any formula. If "Shipping Expense" sits in COGS in your books but in SG&A in your report template, every margin ratio will be wrong. Fix the mapping once, and every future report pulls correctly.
What components does every financial analysis report need?
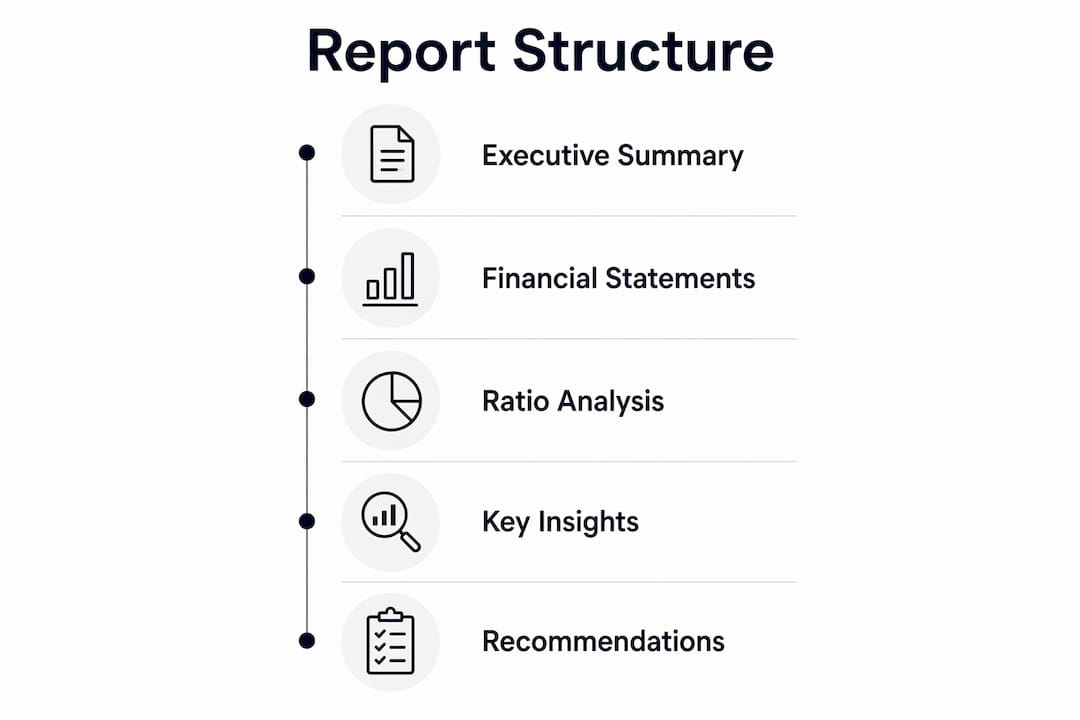
Professional reports follow a summary-first, detail-later structure. Here is a table of contents you can copy directly into a Word or PDF report.
The four financial statements
The SEC identifies the balance sheet, income statement, cash flow statement, and statement of changes in equity as the core financial statements. Each serves a distinct purpose:
- Balance sheet: Snapshot of assets, liabilities, and equity at a point in time. Tells you what the business owns and owes.
- Income statement: Revenue, expenses, and net income over a period. Tells you whether the business is profitable.
- Cash flow statement: Cash inflows and outflows from operating, investing, and financing activities. Tells you whether the business generates or consumes cash.
- Statement of changes in equity: Shows how retained earnings, dividends, and share issuances moved equity during the period.
Standard report table of contents
1. Executive Summary (1 page)
2. Performance Highlights & KPI Dashboard
3. Financial Statements
   3a. Income Statement (current period + prior period + variance)
   3b. Balance Sheet (current + prior)
   3c. Cash Flow Statement
   3d. Statement of Changes in Equity
4. Ratio Analysis & Benchmarking
5. Variance Analysis (budget vs. actual)
6. Forecasts & Assumptions
7. Risk, Covenants & Compliance
8. Appendices (detailed schedules, notes, supporting data)
For lender-focused reports, section 7 should address the 4 C's framework: Capacity (cash flow to service debt), Capital (equity cushion), Collateral (asset coverage), and Conditions (market and macro context). This structure maps directly to how credit analysts evaluate risk.
Which ratios and KPIs should you always calculate?
Group your ratios into four categories. Each group answers a different question a stakeholder will ask.
| Category | Ratio | Formula | What it tells you |
|---|---|---|---|
| Liquidity | Current ratio | Current assets ÷ Current liabilities | Can the business pay near-term obligations? |
| Liquidity | Quick ratio | (Cash + Receivables) ÷ Current liabilities | Liquidity without relying on inventory |
| Profitability | Gross margin | Gross profit ÷ Revenue | How much revenue survives after direct costs |
| Profitability | EBITDA margin | EBITDA ÷ Revenue | Operating profitability before financing and tax |
| Leverage | Debt-to-EBITDA | Net debt ÷ EBITDA | Debt load relative to earnings; key covenant metric |
| Leverage | Interest coverage | EBIT ÷ Interest expense | Ability to service debt from operating income |
| Efficiency | DSO | AR ÷ (Revenue ÷ 12 months) | Speed of collections; rising DSO signals cash risk |
| Efficiency | Inventory turns | COGS ÷ Average inventory | How fast inventory converts to sales |
| Cash flow | Free cash flow | Operating cash flow minus capex | Cash available after maintaining/growing assets |
| Cash flow | Cash conversion cycle | DSO + DIO minus DPO | End-to-end cash cycle from purchase to collection |
On benchmarks: raw ratios mean little without context. For U.S. industry benchmarks, the SEC's EDGAR database gives you comparable public-company filings by SIC code. For private-company benchmarks, tools like Stonk Buddy provide sector-level financial data and AI-driven scoring you can use as external comparators when building your benchmarking section.
When a ratio diverges from the industry median by more than 20%, flag it in the commentary and explain the cause. That is the sentence executives actually read.
How do KPI priorities shift by industry?
The same report structure applies across industries, but the ratios you lead with change based on what drives value in each sector.
SaaS and subscription businesses lead with Annual Recurring Revenue (ARR), net revenue retention, and CAC payback period. Gross margin and churn rate belong in the executive summary. A rising churn rate at stable ARR is a leading indicator of revenue erosion that a standard income statement will not show for another two quarters.
Retail prioritizes same-store sales growth, inventory turns, and gross margin by category. Portfolio company reporting demos show trailing-12-month metrics and customer-product waterfalls that make rolling retail reports far more useful than point-in-time snapshots. A retailer with strong revenue growth but deteriorating inventory turns is building a working capital problem.
Manufacturing centers on EBITDA margin, asset utilization (asset turnover, capacity utilization), and working capital cycle. Raw material cost as a percentage of COGS deserves its own line in the executive summary, as Acme's 180-basis-point margin compression in the sample above illustrates.
Professional services tracks revenue per billable hour or per employee, utilization rate, and project-level margin. Leverage ratios matter less here; cash conversion and client concentration risk matter more.
Construction emphasizes percentage-of-completion revenue recognition, backlog coverage ratio, and bonding capacity. Lender covenant sections for construction firms typically include a minimum tangible net worth requirement alongside the standard debt-to-EBITDA test.
When to add complexity: include LBO-style analysis or segment-level P&L only when the audience is a private equity sponsor or a multi-entity lender. For most management and board packs, the eight-section table of contents above is sufficient.
Where can you download financial report templates?
Three file types serve different purposes, and choosing the wrong one wastes time on reformatting.
Excel (monthly flash report): The best starting point for most teams. Use Power Query to pull data directly from your accounting export, then build ratio formulas on top. The recommended starting file is a three-tab workbook: raw data, calculated ratios, and a dashboard. Smartsheet offers free financial statement templates that include balance sheet, income statement, and cash flow tabs with built-in ratio calculations.
Word/PDF (investor-ready report): Use for quarterly or annual reports that go to external audiences. The Word version allows narrative commentary alongside tables. Export to PDF before distributing. Template.net provides an editable financial analysis report template with pre-built sections for executive summary, ratio analysis, SWOT, and recommendations.
Lender covenant tracker (Excel): A separate workbook dedicated to covenant calculations. Each tab represents one covenant test (debt-to-EBITDA, interest coverage, minimum liquidity). Conditional formatting highlights breaches in red. Update this monthly, not quarterly.
Adaptation checklist before you use any template:
- Map your chart of accounts to the template's line items before entering any data
- Confirm period definitions (fiscal year vs. calendar year; 52/53-week periods for retail)
- Set currency and consolidation boundaries if you have multiple entities
- Audit every formula after mapping: pivot tables and VLOOKUP references break when source data columns shift
- Remove placeholder text and sample data from every cell before distributing
How long does it take to prepare a financial analysis report?
A first full report, built from scratch with raw data, typically takes 15–40 hours depending on data quality and report complexity. The largest time sink is almost always data clean-up: reconciling accounts, fixing classification errors, and building the chart-of-accounts mapping. Once that foundation exists, a recurring monthly flash report drops to 3–8 hours.
Primary cost drivers:
- Data quality: Inconsistent bookkeeping categories add hours of manual reclassification
- Forecasting complexity: A simple 12-month revenue projection adds 2–4 hours; a full three-statement model with scenario analysis adds 8–15 hours
- External review: An external audit or CPA review adds cost and lead time, but is required for most lender and investor packages
Recommended tools:
- Excel with Power Query for data ingestion and ratio calculation; Power Query eliminates most manual copy-paste work
- Visualization add-ins (think-cell, Power BI, or Tableau) for the revenue trend, margin waterfall, and cash runway charts
- Automation platforms that connect directly to your accounting system for accounting automation of month-end close and recurring KPI pulls
Modern best practice moves away from static spreadsheets toward dynamic dashboards that allow drill-down and faster decision cycles. The month-end close is the single biggest bottleneck; shortening it directly reduces time-to-report.
How does Peregrine automate your financial analysis report?
Peregrine connects directly to QuickBooks Online and handles the parts of the report workflow that consume the most time: data ingestion, reconciliation, KPI calculation, and anomaly detection. The result is a CFO-grade report without the 15–40-hour manual build.
What Peregrine automates:
- QuickBooks Online sync pulls live trial balance data into the report structure automatically
- Anomaly detection flags unusual transactions or ratio movements before they reach the executive summary
- Covenant tracking monitors debt-to-EBITDA and coverage ratios against defined thresholds, with alerts when headroom narrows
- Customizable forecasting builds rolling 12-month projections from actuals, updated each close cycle
- Plain-English financial queries let managers ask "what drove the margin drop in Q3?" without building a pivot table
Use cases by audience:
- Small finance teams: monthly management pack generated in hours instead of days
- Fractional CFOs: multi-client roll-ups with role-based access, so each client sees only their data
- Portfolio managers: board-ready summaries with TTM metrics and variance commentary, ready for distribution
Peregrine is particularly useful for FP&A workflows where the line between accounting close and forward-looking analysis blurs. The platform handles the data layer so the analyst can focus on interpretation and recommendations, which is where the actual value lives.
Key Takeaways
A well-structured financial analysis report leads with the executive summary, covers all four financial statements, and focuses on six to ten ratios that directly answer what your specific audience needs to know.
| Point | Details |
|---|---|
| Start with the executive summary | Lead with "so what" — what changed, why, and what to do. Attach detail schedules at the back. |
| Include all four statements | Balance sheet, income statement, cash flow, and statement of changes in equity are the non-negotiable foundation. |
| Prioritize six core ratios | Current ratio, gross margin, net margin, debt-to-EBITDA, DSO, and free cash flow cover most stakeholder questions. |
| Tailor KPIs to your audience | Lenders want coverage and leverage; investors want growth and margin; management wants efficiency and cash. |
| Peregrine accelerates the process | Peregrine's QuickBooks Online integration automates data ingestion, KPI calculation, and covenant tracking, cutting first-draft time significantly. |
The part most finance reports get wrong
Most financial analysis reports spend 80% of their pages on historical data and about two paragraphs on what to do next. That ratio should be closer to 50/50. A CFO reading a 40-page report already knows revenue was up 8%. What they need is a clear answer to: is this trend durable, what is the risk to the forecast, and where should capital go next?
The executive summary is where that argument lives or dies. Write it last, after you have worked through the full analysis, but structure it as if it is the only page the reader will see. Three sentences on what happened, two sentences on why, one sentence on the recommended action. If the executive summary cannot stand alone, the report is not finished.
The other mistake is automating before standardizing. Connecting a reporting tool to messy books does not produce clean reports. It produces wrong reports, faster. Before any automation, map the chart of accounts, reconcile the opening balances, and confirm that every category in the template matches a category in the source data. That work is not glamorous, but it is what separates a report that builds trust from one that generates questions.
Get CFO-grade reports without the 40-hour build
Most small finance teams and fractional CFOs spend more time cleaning data than analyzing it. Peregrine flips that ratio. By connecting directly to QuickBooks Online, it ingests your trial balance, calculates your KPIs, flags anomalies, and generates a board-ready report pack automatically, so your team spends time on interpretation, not spreadsheet maintenance.
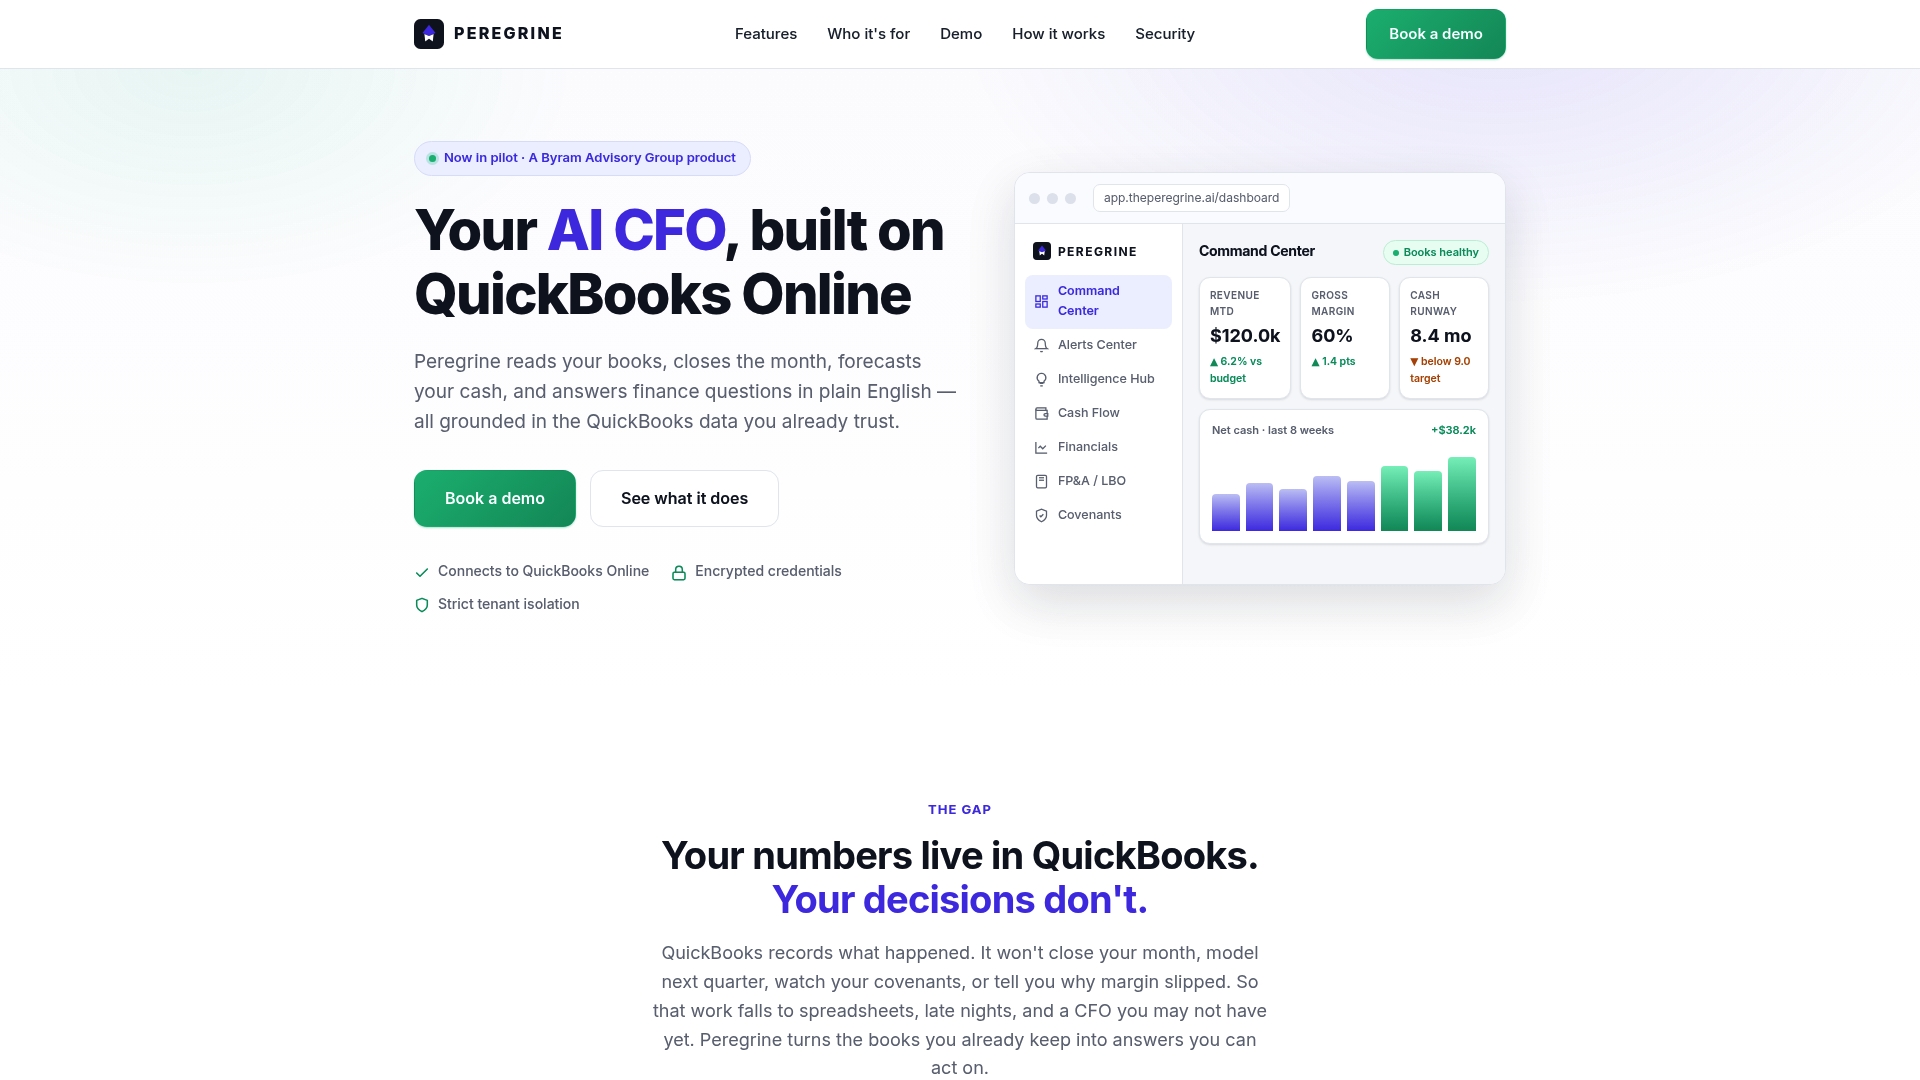
The 14-day free trial gives you a live report built on your actual QuickBooks data. Connect your first entity, and Peregrine maps your chart of accounts, runs the ratio suite from the table above, and surfaces any covenant or cash-flow alerts within the first session. For AI accounting software that fits the way small finance teams actually work, Peregrine is the practical starting point.
Start your free trial at theperegrine.ai and have your first automated report ready before your next board meeting.
Useful sources and example reports
These sources were used as models and references throughout this article. Each serves a different purpose depending on what you need.
- SEC.gov — Financial Statements and Reporting: The authoritative source for the four required financial statements and public-company reporting standards. Use for regulatory reference and to pull comparable 10-K filings via EDGAR for benchmarking.
- Moneysoft Sample Financial Analysis Report (PDF): A complete example of a professionally structured analysis report, including executive summary, ratio section, common-size analysis, and appendices. Download it to see how a finished report is formatted before building your own.
- Walmart 2026 Annual Report: Walmart reported $713.2 billion in total revenues for fiscal 2026. Use this as a model for MD&A narrative, segment discussion, and the formal structure of a statutory annual report versus a management report.
- BUCS Insights PortCo Sample Report (PDF): Demonstrates TTM metrics, CAGR trends, and customer-product waterfall visuals. Useful for portfolio company and multi-entity reporting formats.
- Smartsheet Free Financial Statement Templates: Free Excel templates for balance sheet, income statement, and cash flow with built-in ratio calculations. Good starting point for teams building their first template.
- Template.net Financial Analysis Report Template: Editable online template with pre-built sections for executive summary, ratio analysis, SWOT, and recommendations. Useful for investor-ready Word/PDF reports.
- Peregrine — AI CFO built on QuickBooks Online: For teams that want to automate the data ingestion, KPI calculation, and report generation steps described in this article. Start with the 14-day free trial.